 Ondina Frate
The work flow that scientists at Merck are going through is that they would go on Chem Chart software to check how well a compound did. The problem was that a lot of the times they couldn’t find a specific compound and also they were never able to see how well a compound did through testing on the same page with the compound’s chemical structure. It was a very overwhelming and not effective way of working.
So we came up with these wireframes to establish the flow of the software that we were going to build.
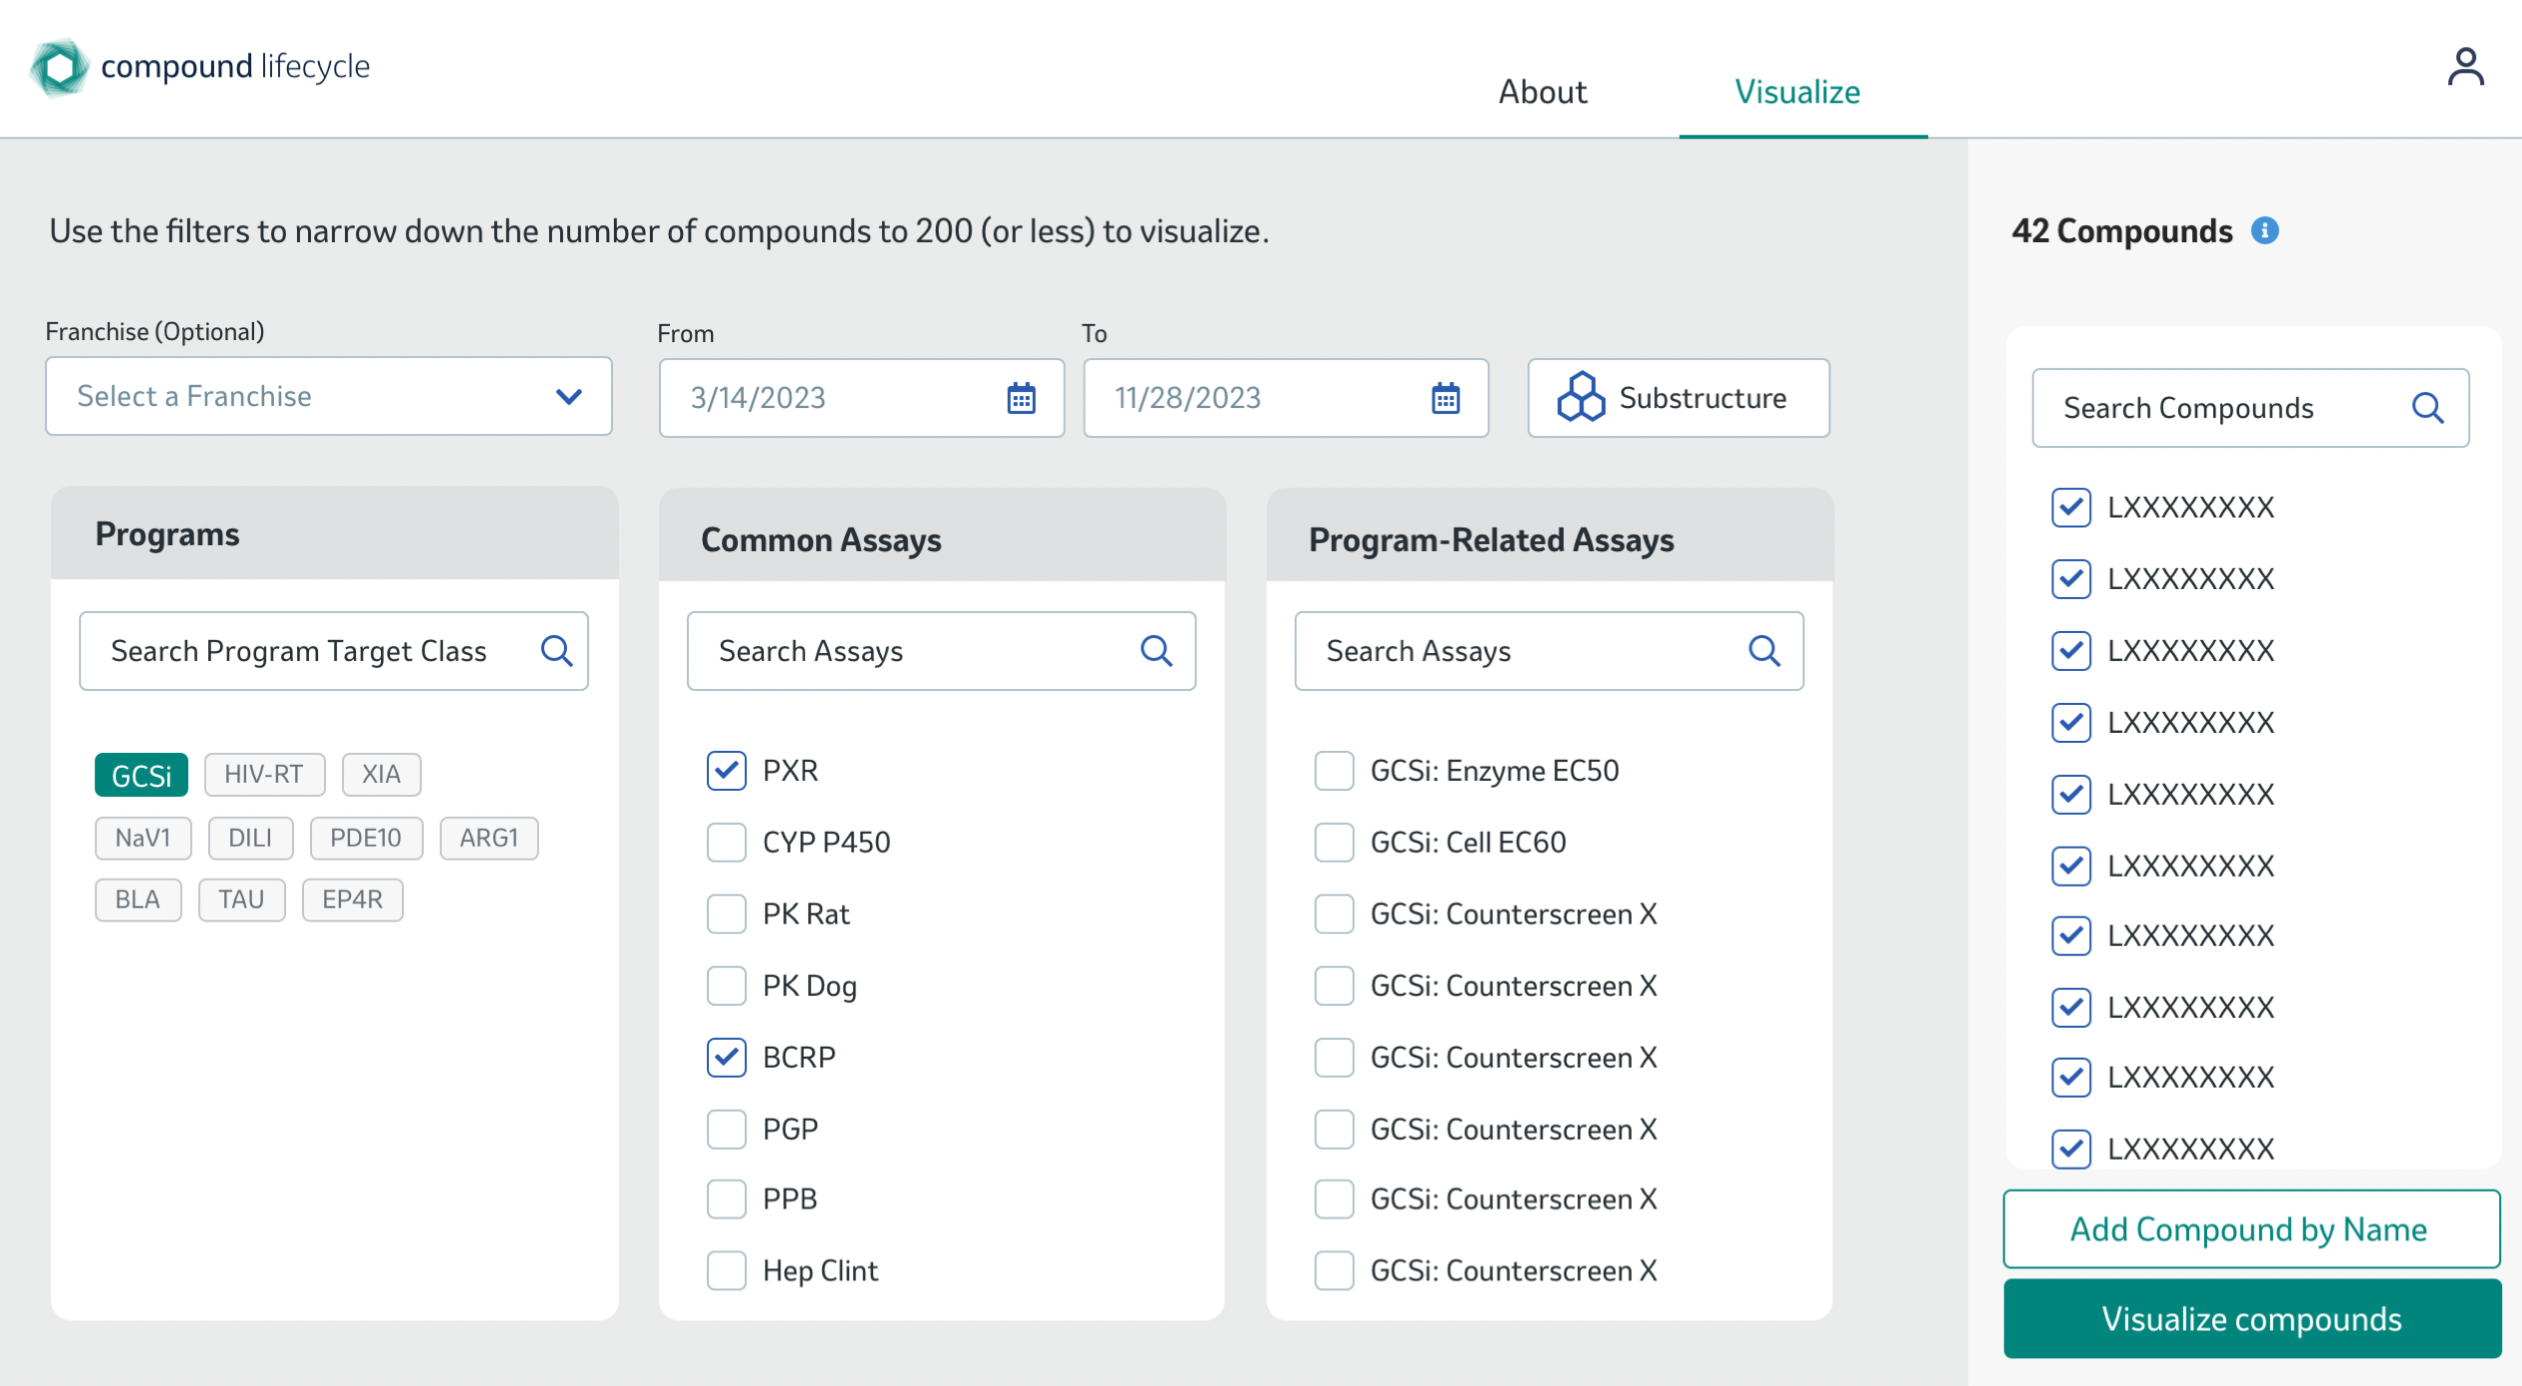
Since our users were scientists at Merck we knew they know exactly which compound or assay they need to see. So I thought of narrowing down the amount of data by making the user choose which category they want to explore. Here you can see a page that allows the user to add filters to the data. Only once the user has less than 100 compounds, they would be able to view the data in the visualization mode.
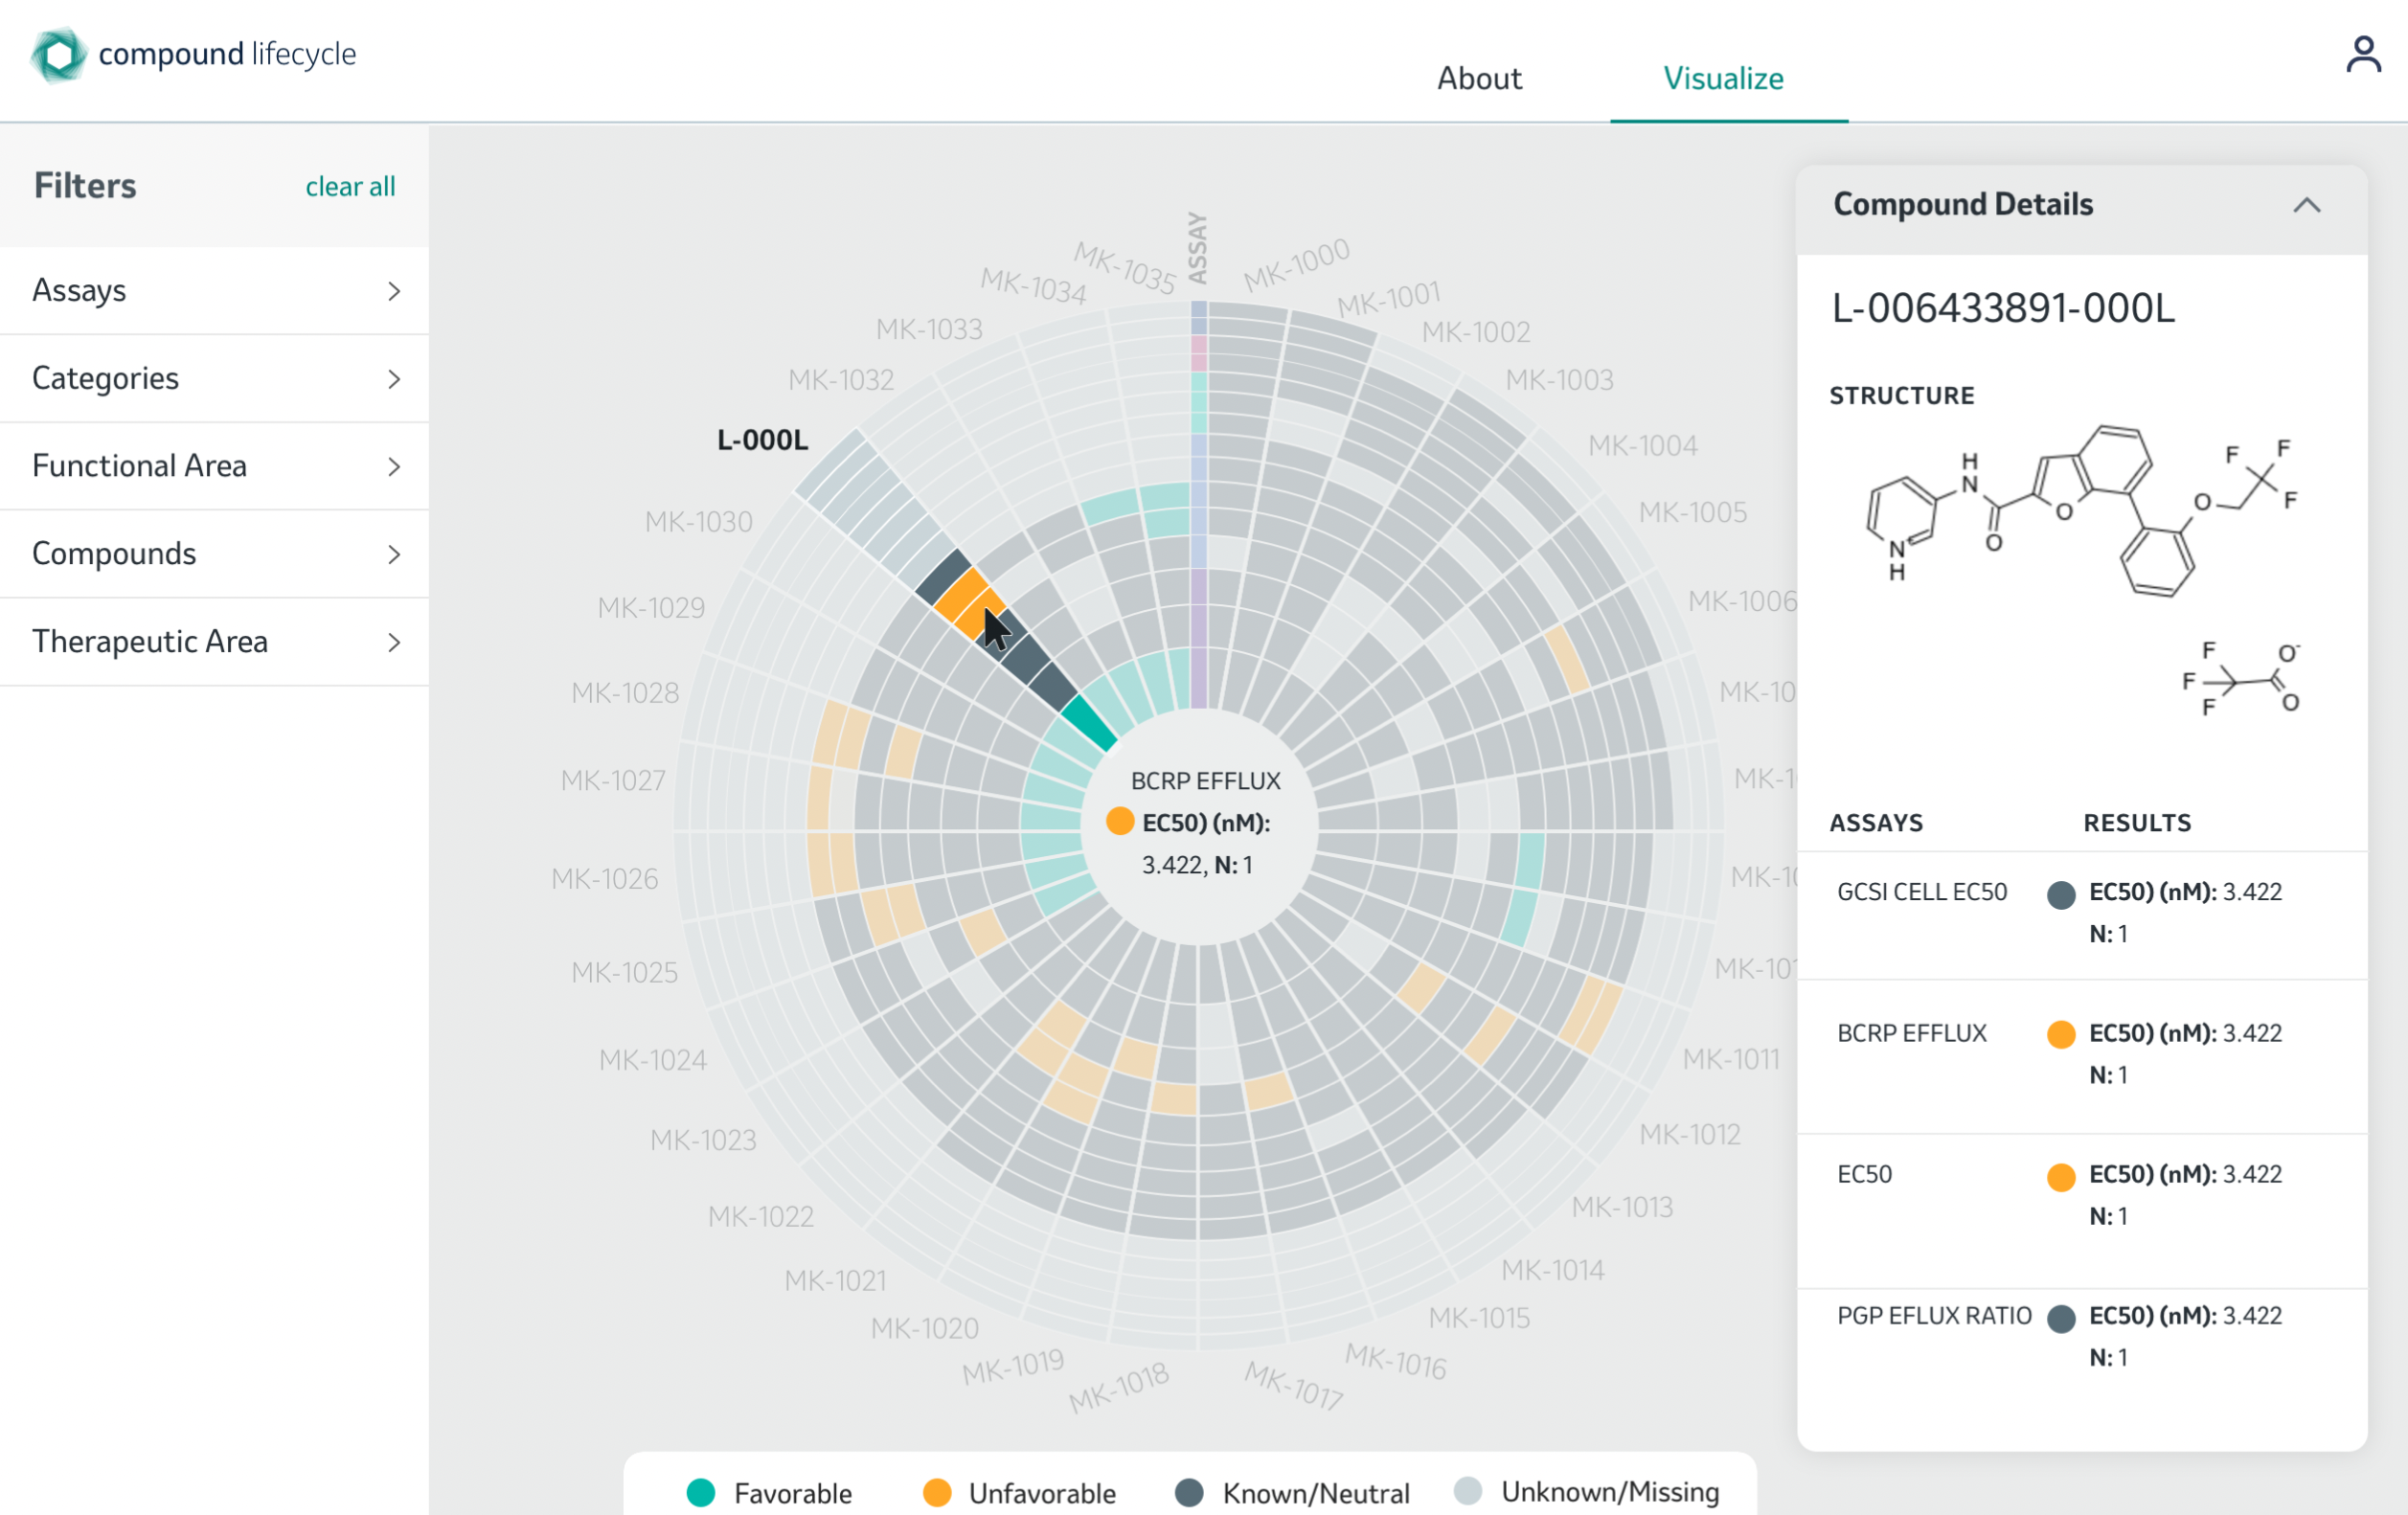
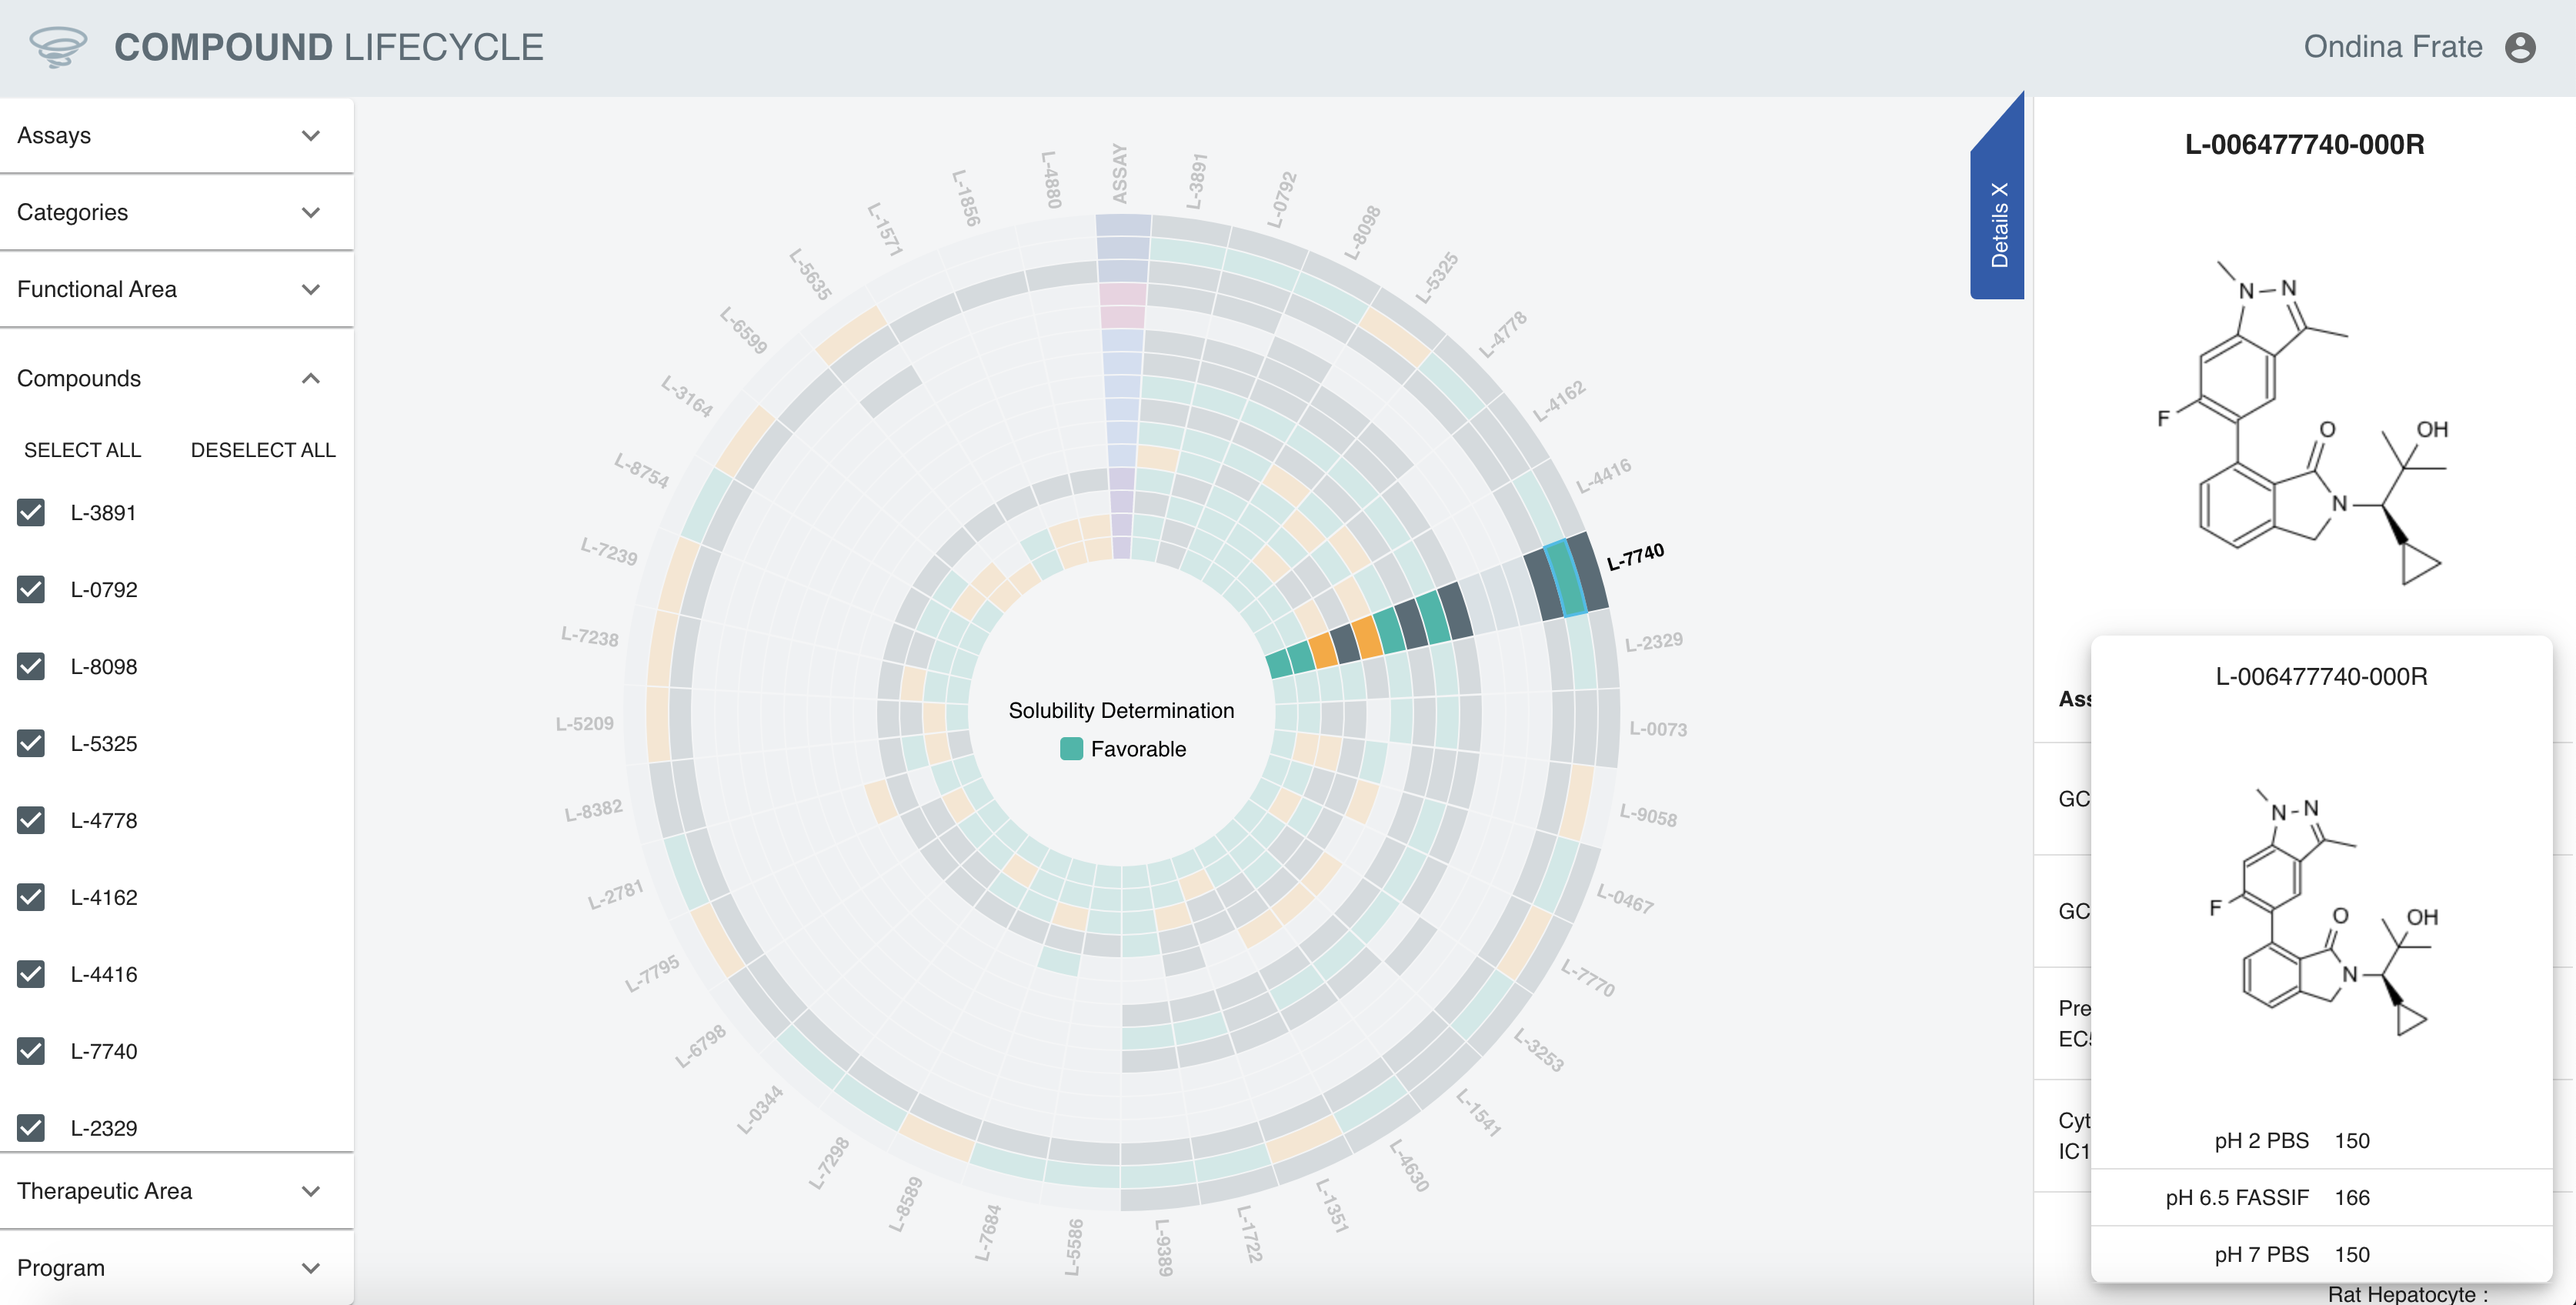
This is the actual app that I’ve designed and built. Green meant it performed well, dark grey meant it was neutral, yellow meant the compound failed testing, and light grey meant that compound was missing. We chose this colors so we can easily see which compounds did well.
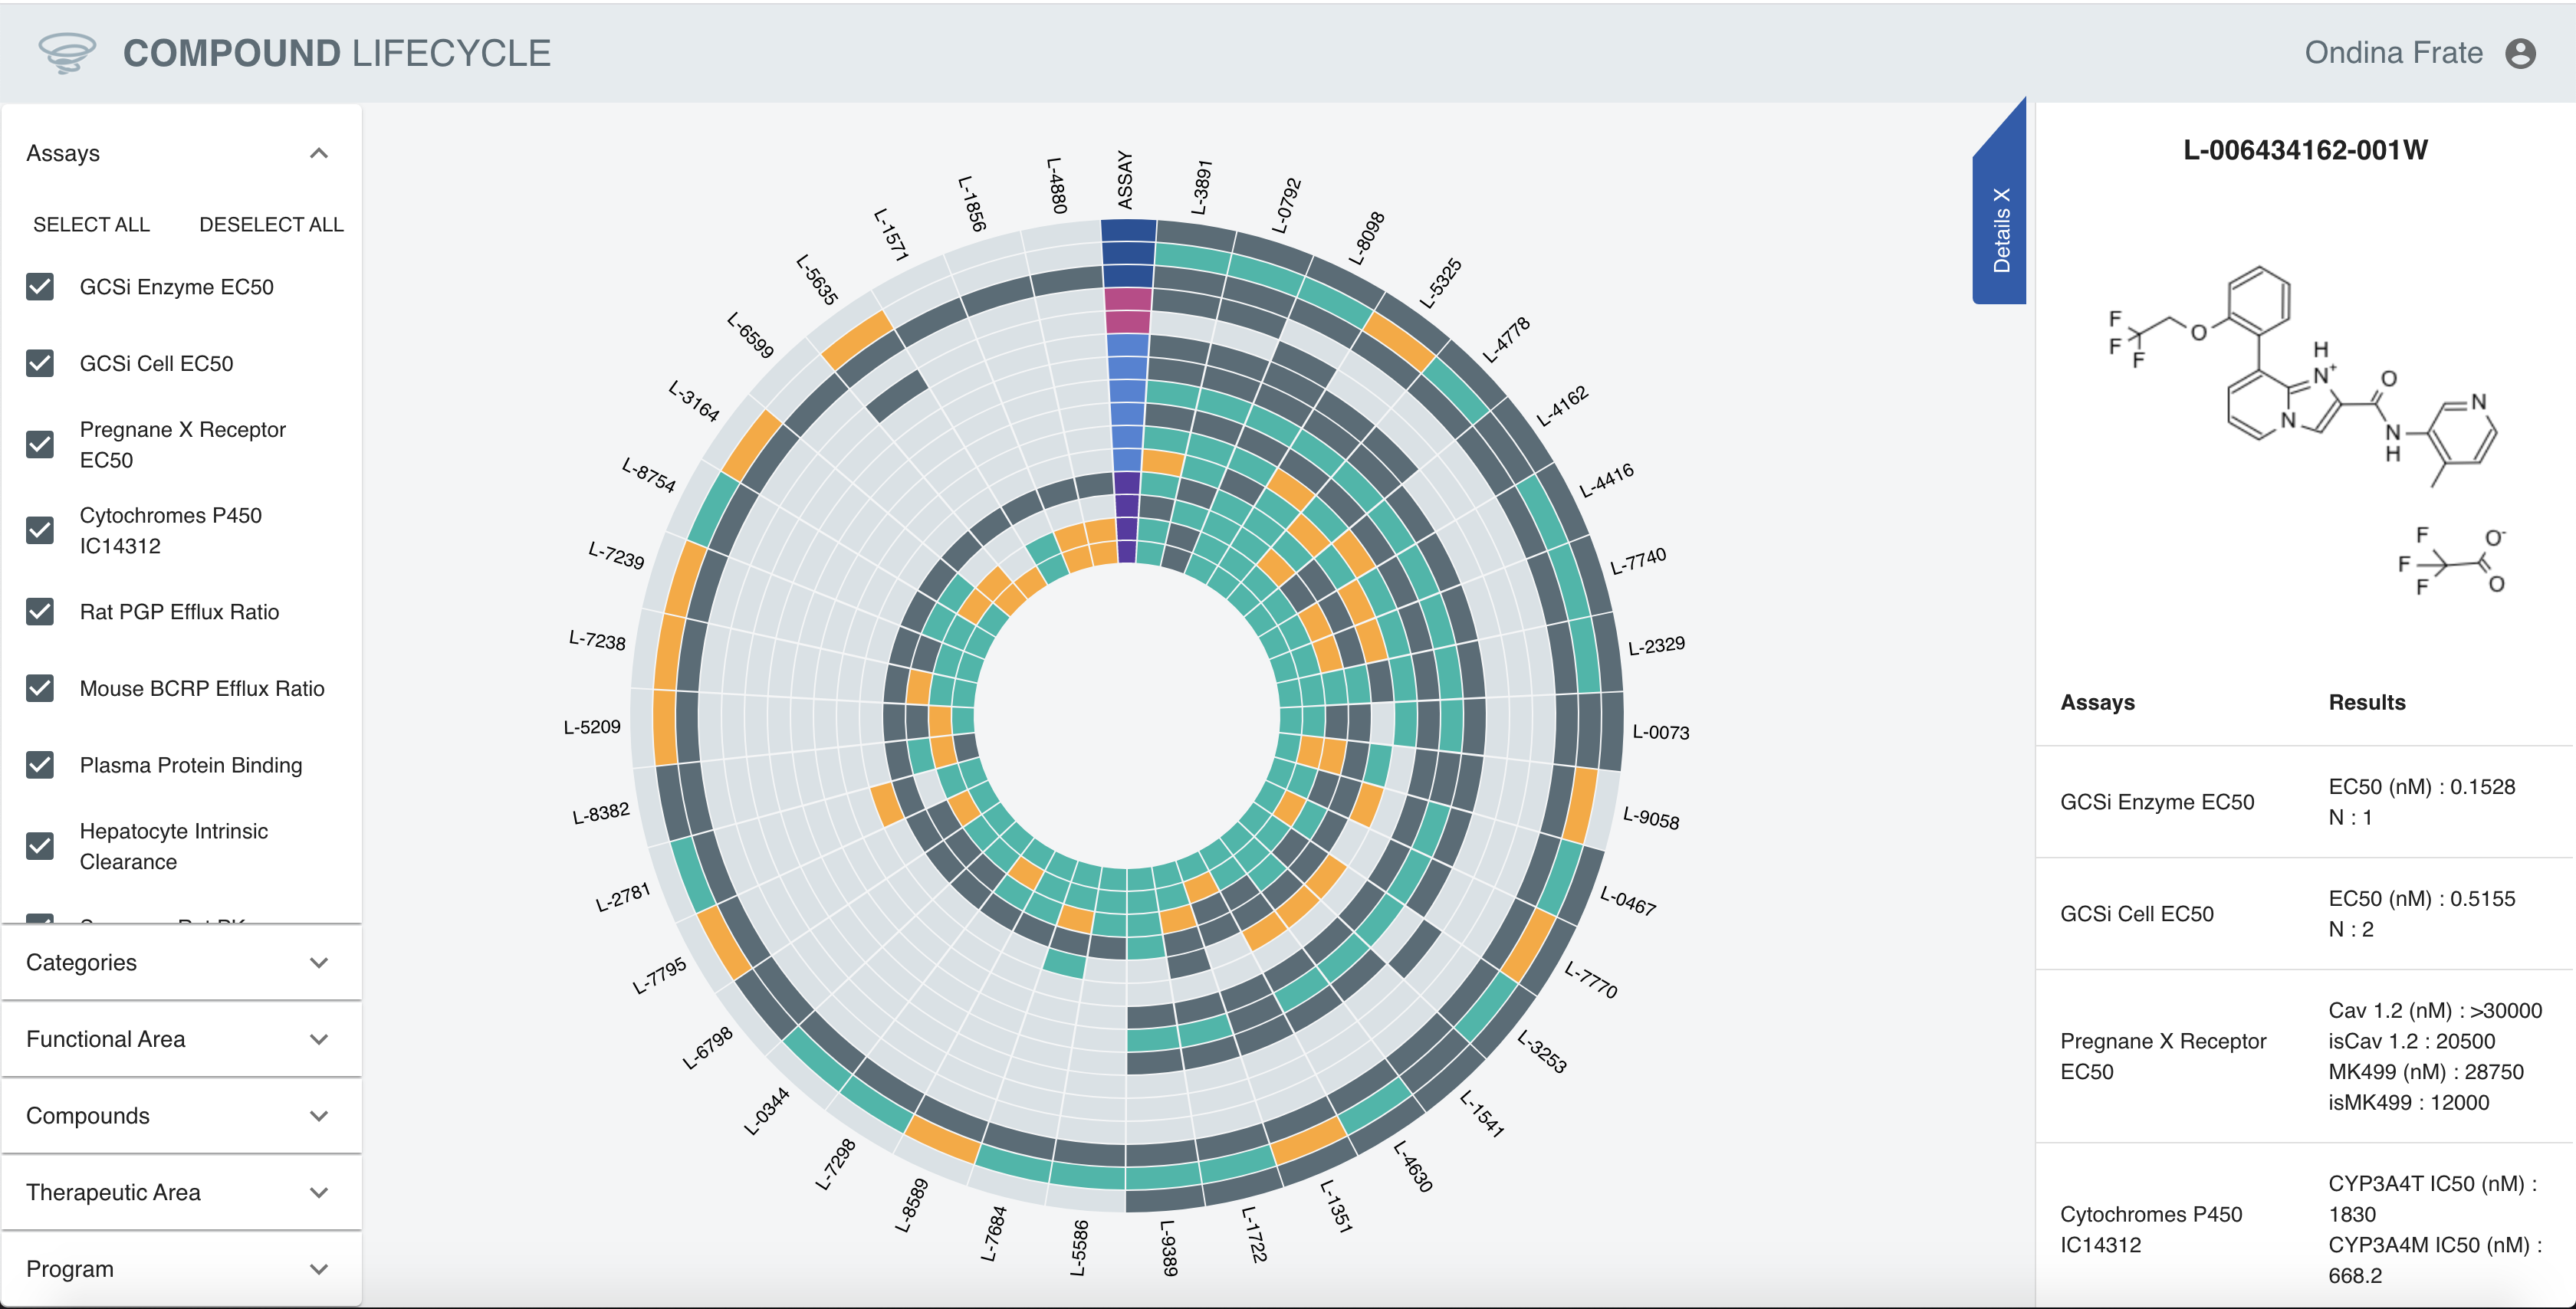
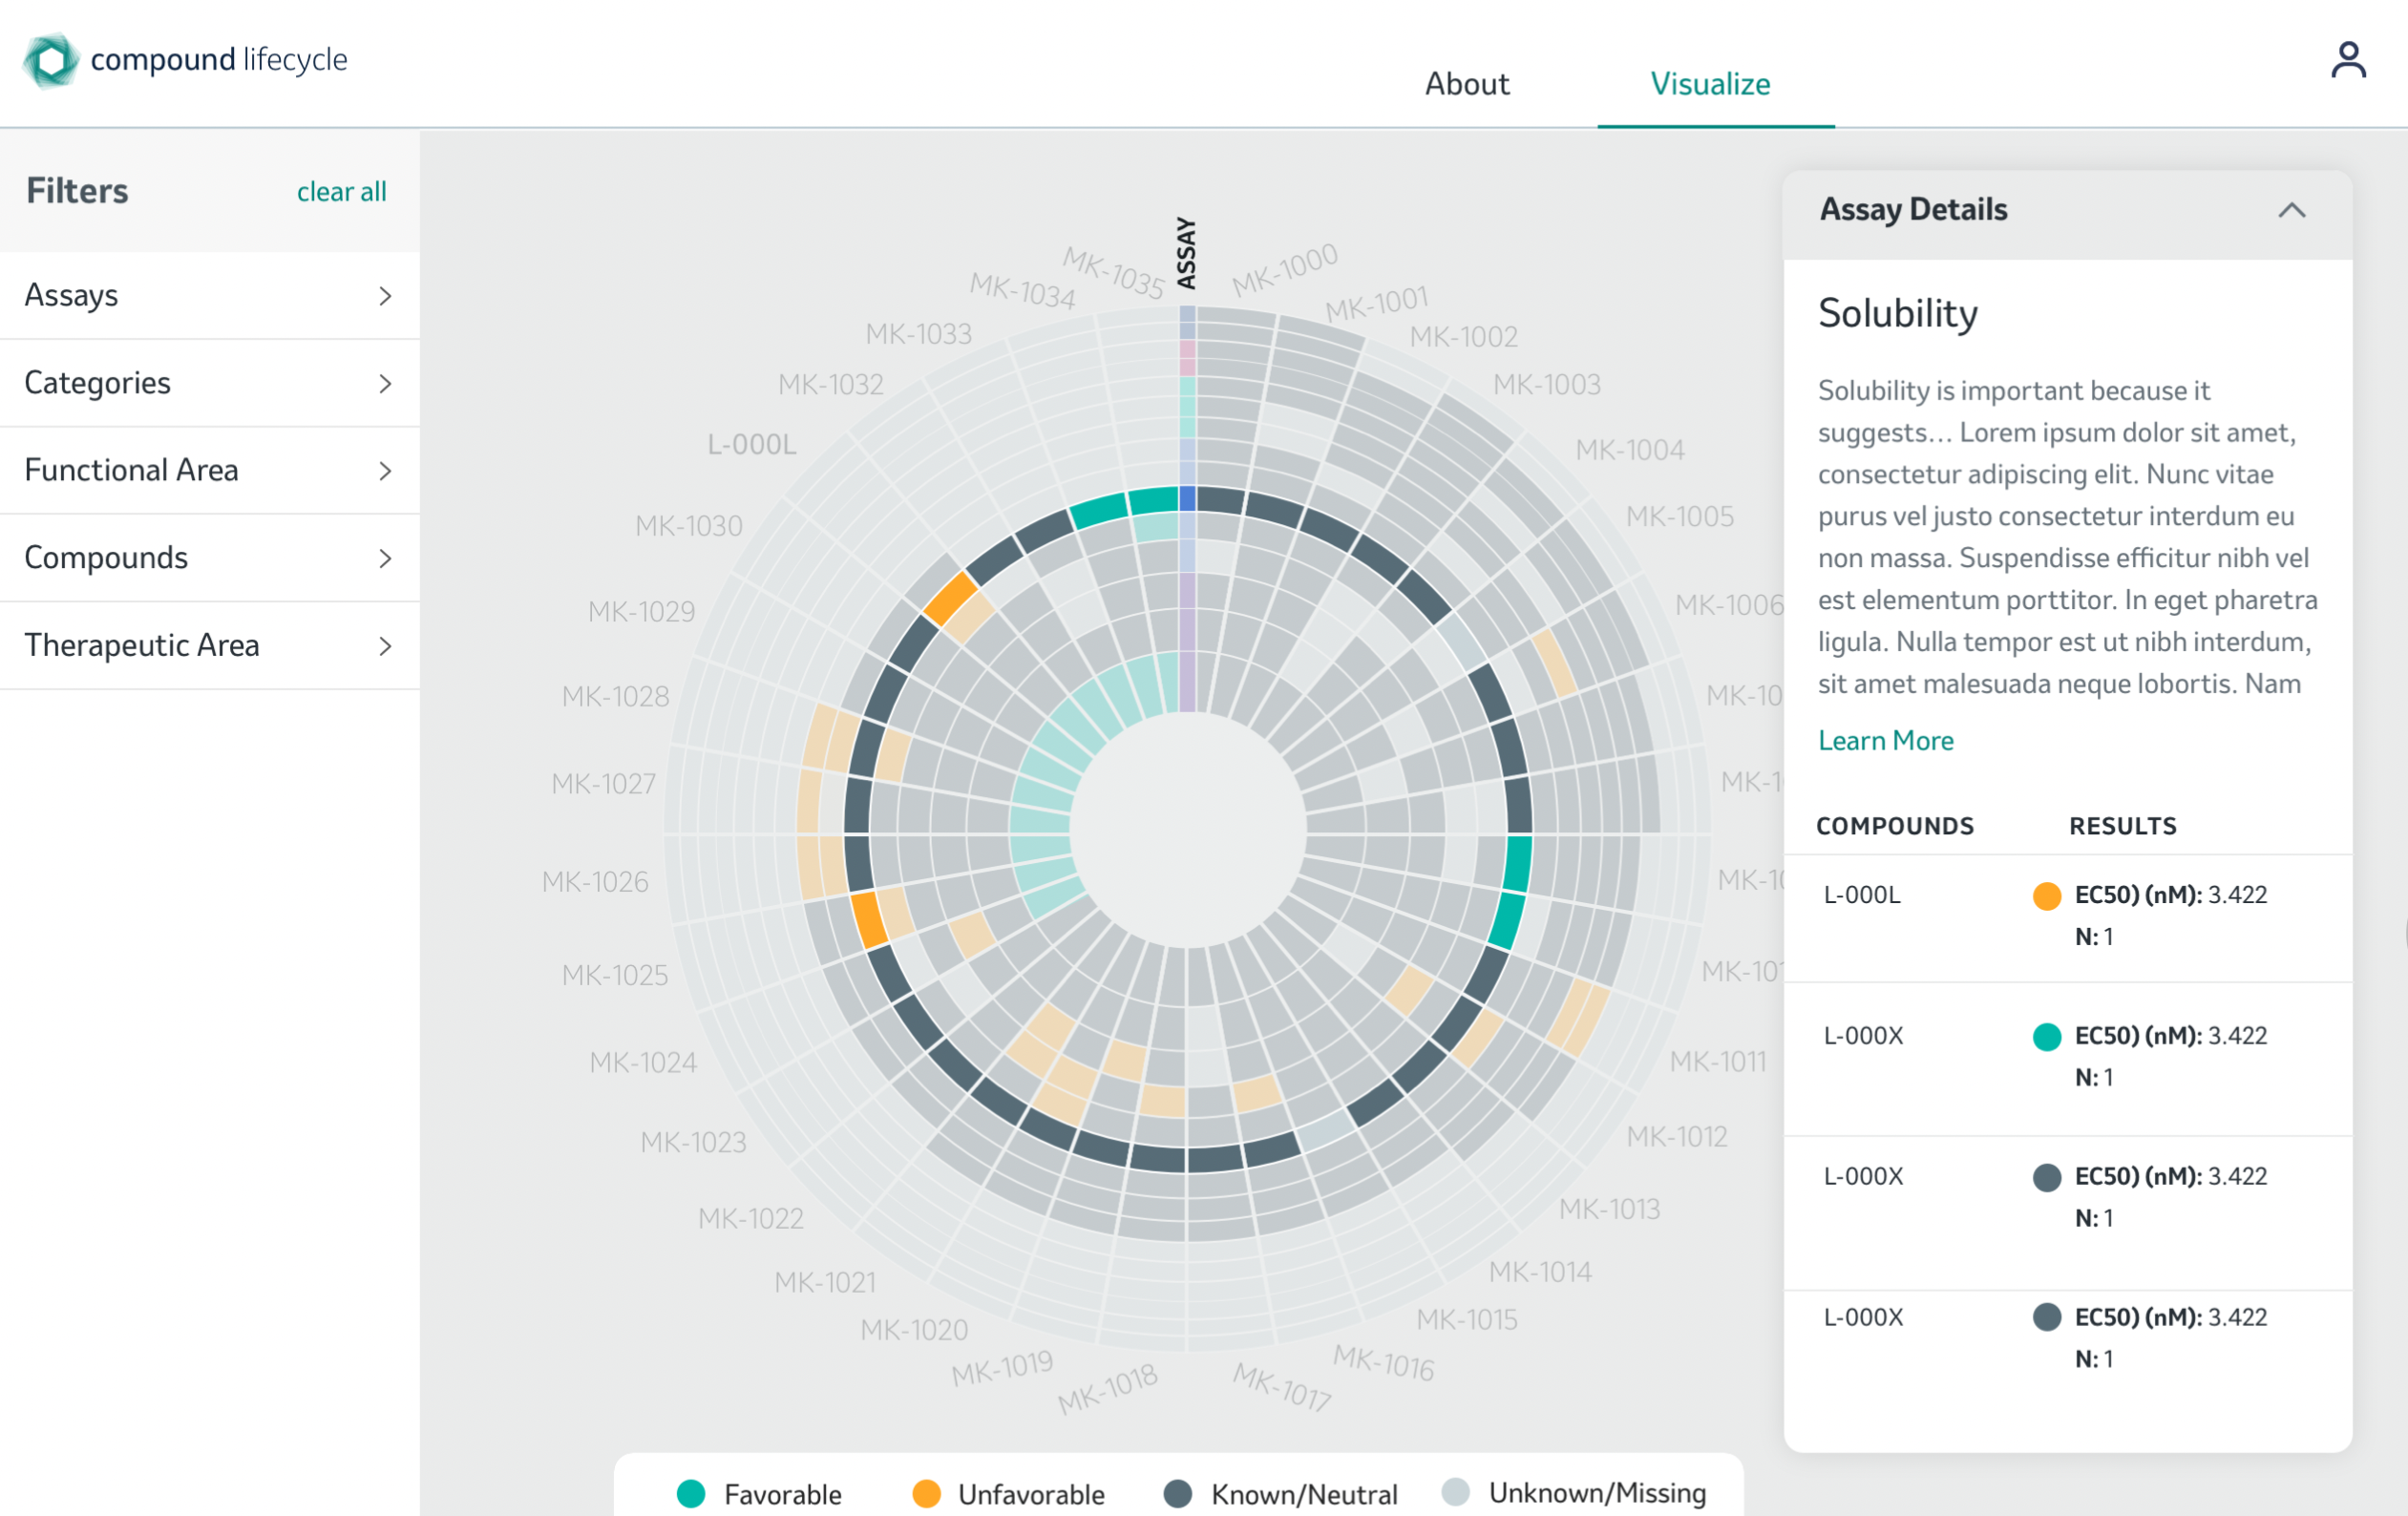
Here for example we are showing compound L-7740 and the user could see very easily see how well the compounds did throughout this testing Solubility Determination as well as the compound structure on the right.

Here is cytochromes testing that includes all compounds and you can see only 6 of the compounds did well through this testing. This was a very fast and efficient way to see which compounds performed well.
Software Demo
This is the latest version of the app that I’ve designed and built. The users can visualize a compound number and how it did through an assay and based on the needs, can filter on the left side the compounds, assays, or categories. This project was very complex and it allowed me to learn a lot about organic chemistry, about how scientists work at Merck, about cross-function working, and about visualizing a big amount of data. We presented this project at the Merck Tech Symposium in 2020. Scientists at Merck are currently using this app which is saving them a lot of time and they find it very efficient.